Use PyGWalker in Kaggle Notebooks
PyGWalker is a great tool using in juypter notebook or juypter lab. But Kaggle notebooks has some limitions and different you need to know. This article will show you how to use PyGWalker in Kaggle notebooks.
Install PyGWalker
Kaggle environment does not have pygwalker installed by default. You need to install it first. In kaggle, you can install it in notebook directly.
!pip install pygwalker
import pygwalker as pyg
Install a python may bring lots of console output. You can use !pip install pygwalker -q to hide the output.
# recommend install pygwalker in quiet mode
!pip install pygwalker
import pygwalker as pyg
Basic Usage
For basic usage, which turns your dataframe into interactive data app, you can use it as usual.
# load data
df = pyg.load_data('data.csv')
pyg.walk(df)
Advanced Usage
If you do not know how to save the charts you made in pygwalker in juypter notebook, check this tutorial fitst.
Problem 1: Cannot see the visualizations we made in preview.
Now we are facing some differences between kaggle and juypter notebook/lab. Usually, when we enable use_preview=True, we can share the notebook with others which all visualization we made in pygwalker can directly shown even you do not start the notebook kernel.
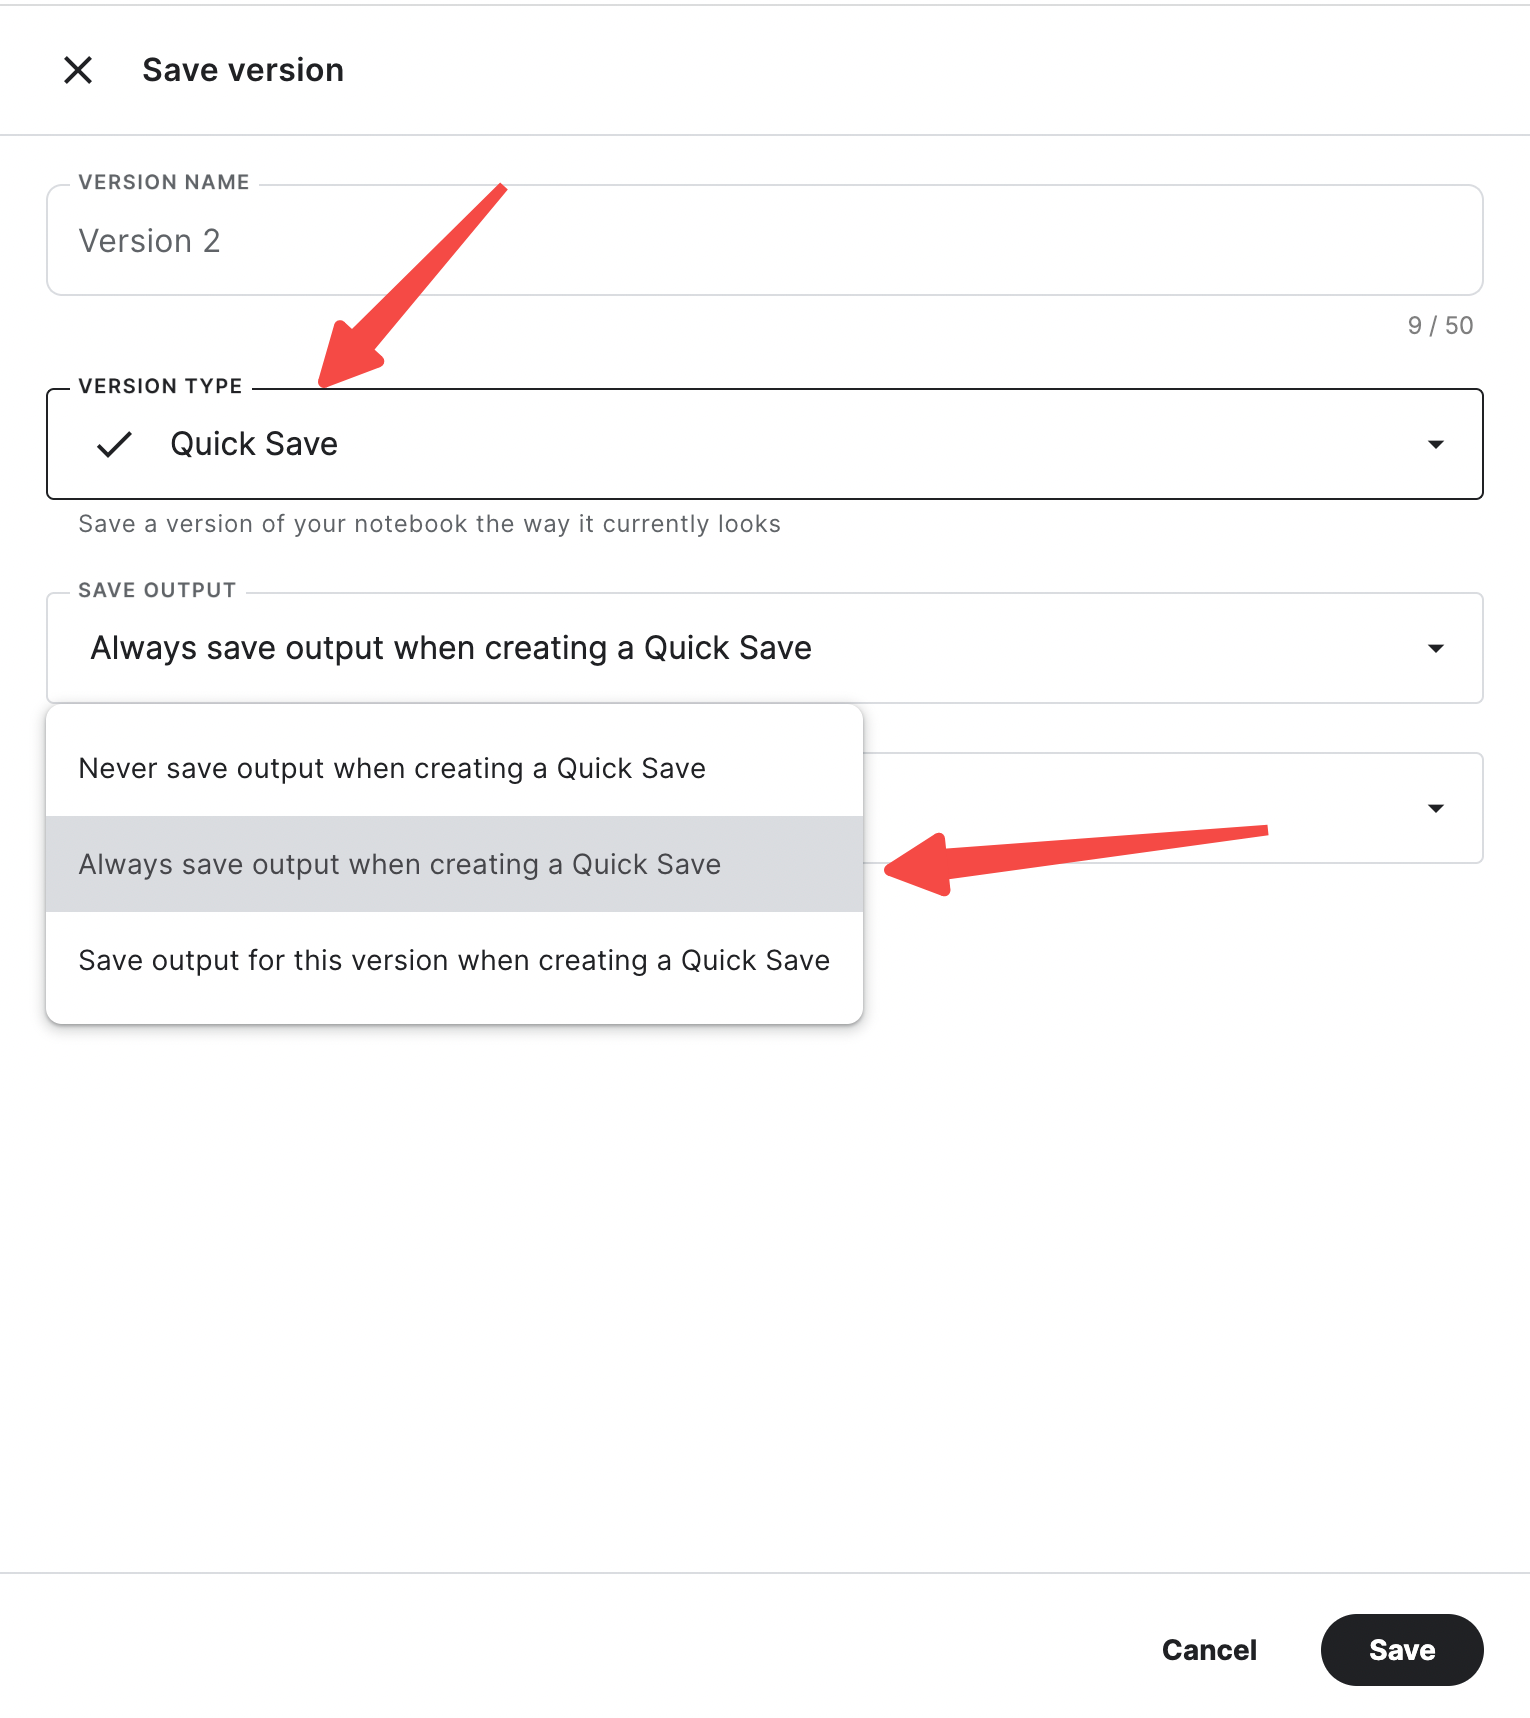
But in kaggle, we need to set
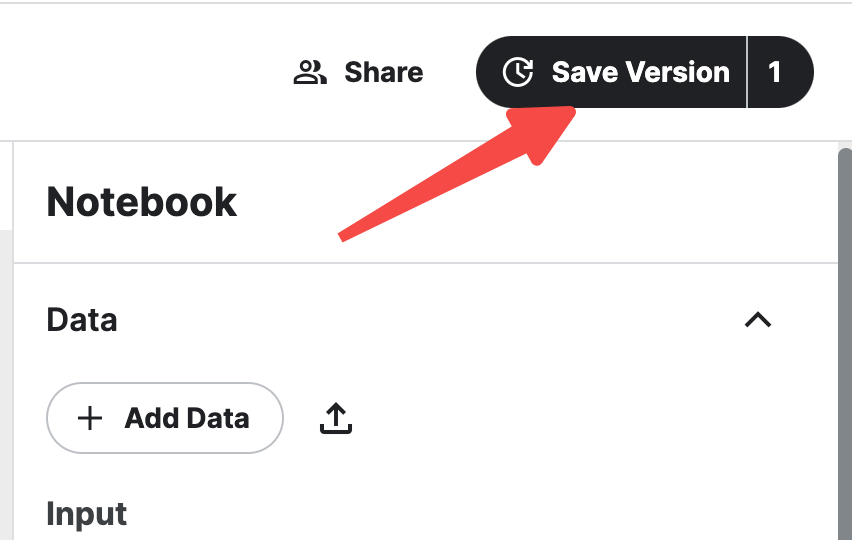
Version typetoQuick SaveSave outputin Advanced Settings to beAlways save output when creating a quick save.


Problem 2: Cannot directly save the visualizations as file to output directory.
Kaggle do not support share files in your output file, so you have to move the file to your input directory and then read it from there.
Support
If you have any questions, please feel free to discuss with kanaries team in Discord, Github, or Kaggle.